Specification
Background
A typical IT support environment is governed by service level agreements (SLA’s) that define expected levels of service in terms of a variety of metrics such as ‘minimum first response time’ or ‘maximum resolution time’ for each ticket logged. However, adherence to these basic standards does not necessarily result in customer satisfaction. An IT support center also strives to take actions that will result in the best possible customer satisfaction outcome for each ticket logged.
Technicians typically prioritize their worklists according to SLA metrics, and often the decision around ‘which ticket should I give attention to next?’ depends on a ‘last-in, first-out’ approach – unfortunately sometimes in combination with ‘which one of these jobs looks easiest?’.
Tasks
Our aim is to provide regularly updated information on which open tickets are at risk of a low customer satisfaction rating, based on actions (or lack thereof) as each ticket progresses.
Objectives
The proposed Decision Support System (DSS) enhancement will be represented as a Bayesian network, the outputs of which will be incorporated into the current service desk software in addition to the information already available on which tickets are going to fall outside of the agreed SLA parameters. By doing so, we hope to enable technicians and managers to make better decisions on which tickets to prioritize in terms of response, updates, and resolutions.
Constraints
Customer satisfaction can be influenced by many factors. As a former manager in the IT support domain, however, I have selected 5 main contributing factors. In a real-world situation we might want to look at additional factors and more complex interdependencies between the factors but as a ‘proof of concept’, I want to ensure that the model is kept simple and interpretable.
Conceptual design
Architecture & components
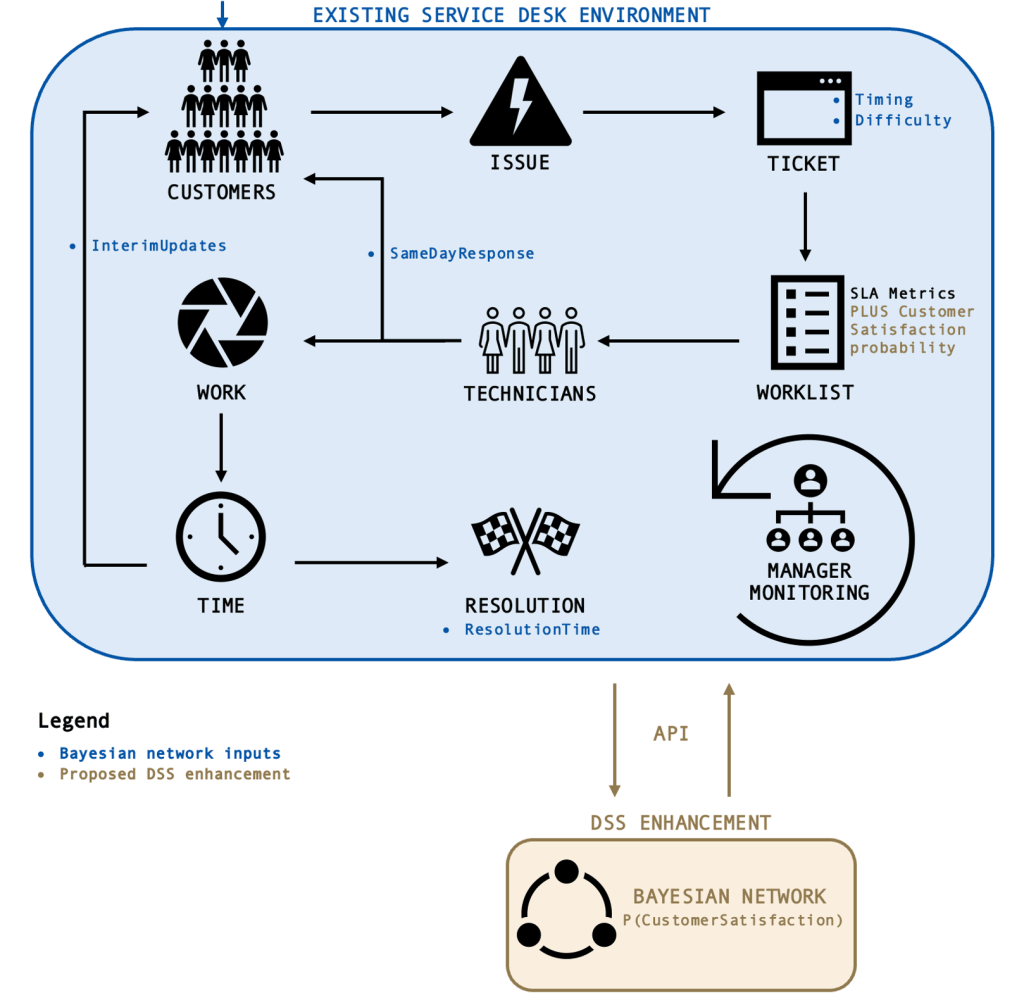
Figure 1 depicts the overall architecture envisaged for the implementation of the proposed DSS. In the existing service desk environment, Customers, upon experiencing an IT issue, log a ticket with the Service Desk. Based on the type of ticket logged, the system automatically assigns a Difficulty rating, and of course, we know the Timing of when the ticket was logged. Tickets are displayed in a Worklist which Technicians use to decide which issues to work on next. Once a technician has taken on a ticket, they respond to the customer via the system so we can track SameDayResponse. As work progresses and time passes, the technician may decide to send the customer one or more InterimUpdates. This is also done via the system so that it can be tracked. Once the issue has been resolved, the ticket is closed, and the customer is informed – at this point we now have the ResolutionTime. Managers monitor the worklists and progress indicators against SLA requirements and assist technicians with prioritizing and re-prioritizing wherever they think necessary.
Integration to service desk software
Most service desk software tools (for example SAP Solution Manager (SAP AG, 2022) or Atlassian Jira (Atlassian, 2022)) are customizable and provide an API (Application Programming Interface) that allows integration with third-party tools. It would therefore be quite feasible to regularly push the latest information about tickets to an external Bayesian network model. This model would then return the latest CustomerSatisfaction probabilities to the service desk software for incorporation into the ticket/worklist data used by staff.
Inputs and outputs
The Bayesian network will use however many of the input data points (highlighted in blue in Figure 1) are available at any given time to estimate, at each stage of the process, what the probability is of an acceptable CustomerSatisfaction outcome. The resulting output, the CustomerSatisfaction probability, will then be integrated back into the existing service desk environment. For purposes of this assignment, the probabilities associated with each node have been estimated based on my own domain knowledge as outlined in Tables 1 to 6. It is important to note, however, that in productionizing such a model, we would learn the probability parameters from past data (Ankan, 2022) so that the model would continuously update itself over time.
Stakeholders
IT technicians and their managers are our primary stakeholders. It is interesting that both groups are typically incentivized to maximize customer satisfaction ratings through a system of key performance indicators (KPI’s): the higher one’s average customer satisfaction ratings, the better one does at the annual employee review, which in turn is often linked to salary increases and/or performance bonuses. Most service desk software, however, does not provide any kind of real-time information on which tickets are on track for a good rating or not! By making this information available we can empower technicians and managers to proactively optimize their actions and priorities to ensure both SLA compliance and customer satisfaction.
The IT support center’s customers are of course also stakeholders – ultimately the point is to ensure that they don’t just receive the minimum required service but the best service possible.
Risks
Insufficient data – Ideally, we would want the conditional probabilities used by our network to be based on the actual outcomes we see in historical data, and not just ‘expert estimates’. However, not all customers rate tickets so we would need to assess whether sufficient data is available, or whether we need to accumulate more data before this becomes a realistic approach.
Unhappiness bias – We know that customers often take the trouble to rate a ticket when they have had a bad experience, but when they are satisfied, they often do not bother to rate. This bias would need to be interrogated, and decisions would need to be made on how to adjust for the phenomenon both in our initial model and over time as the model updates itself based on new data.
Increased complexity – In one sense we will increase the complexity of the decision-making process – which is still ultimately in the hands of technicians and their managers. Instead of having to consider one thing (SLA requirements), they will now have to balance two things (SLA requirements and customer satisfaction). Once implemented performance should be frequently evaluated to assess whether the desired improvements are really being achieved or not.
Bayesian network
Description
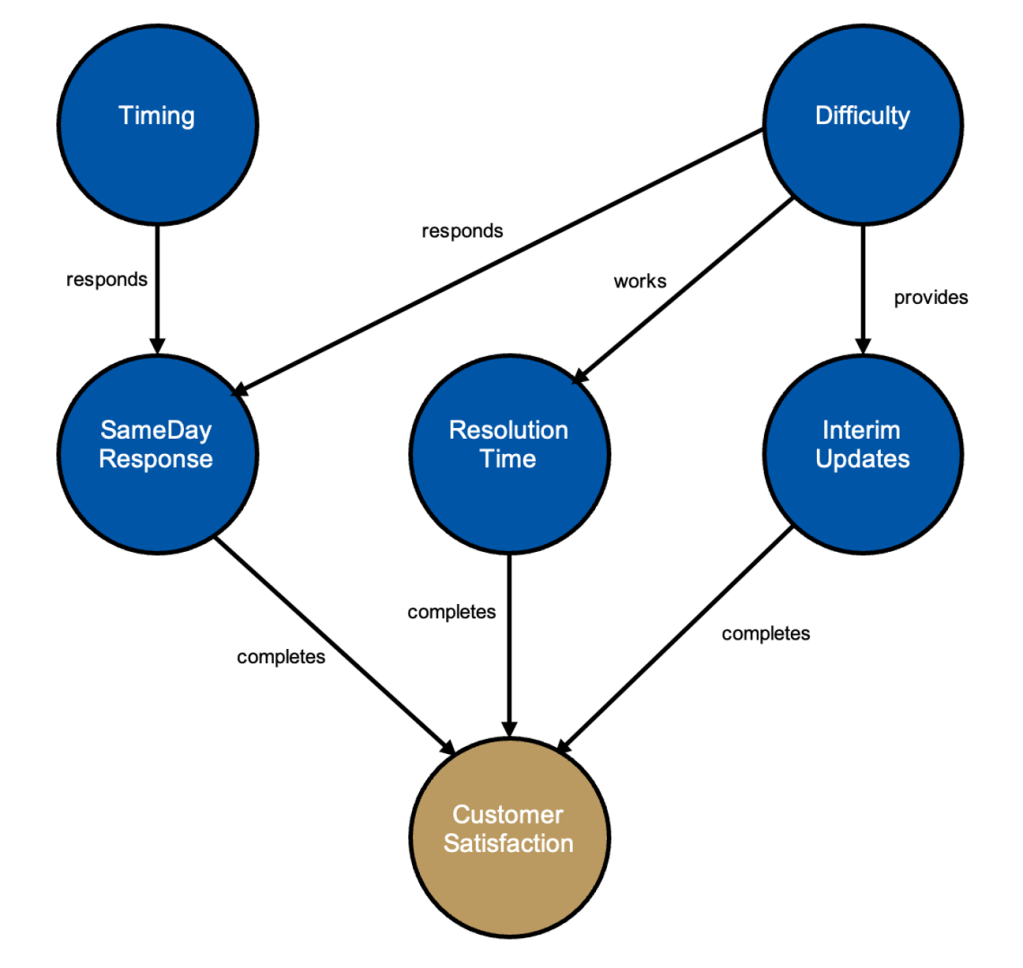
The following diagram depicts the structure of the Bayesian network we will use to model factors contributing to customer satisfaction. As I said we could easily build a more complex model, but these are the core components. Factors we cannot influence include Timing and Difficulty: these are the main aspects we know about a ticket when it is first logged. Factors we can influence include SameDay response, ResolutionTime and InterimUpdates: these are frequently mentioned in customer compliments and complaints as direct contributors to the CustomerSatisfaction outcome:
Construction
The following section describes each node and its links, and on what basis the probabilities have been estimated.
Timing node: Was the ticket logged in the AM or the PM? Slightly more tickets get logged in the mornings compared to the afternoons.
| Timing | P(Timing) |
| AM | 0.6 |
| PM | 0.4 |
Difficulty node: Tickets are automatically graded according to difficulty: easy, medium, or hard. Most tickets fall into the medium category.
| Difficult | P(Difficulty) |
| easy | 0.1 |
| medium | 0.6 |
| hard | 0.3 |
SameDayResponse node: Did a technician contact the customer that same day to acknowledge they have the ticket and will work on it? True or False. Experience tells us that this could be influenced by both the timing of the ticket (tickets logged late in the day are less likely to receive a same-day response) and by the difficulty of the ticket (human nature being what it is technicians may tend to tackle easier tickets first).
| Timing | Difficulty | P(SameDay Response = True) | P(SameDay Response = False) |
| AM | easy | 0.95 | 0.05 |
| AM | medium | 0.8 | 0.2 |
| AM | hard | 0.6 | 0.4 |
| PM | easy | 0.5 | 0.5 |
| PM | medium | 0.3 | 0.7 |
| PM | hard | 0.1 | 0.9 |
InterimUpdates node: Did the technician provide updates on the progress of the ticket as time progressed? The number of updates is set at 0, 1, or 2+. This factor is also influenced by the relative difficulty of the ticket: easy jobs will be resolved quickly, and updates may be irrelevant – but the longer a job drags out the more important such updates become.
| Difficulty | P(Interim Updates = 0) | P(Interim Updates = 1) | P(Interim Updates = 2+) |
| easy | 0.95 | 0.05 | 0 |
| medium | 0.3 | 0.4 | 0.3 |
| hard | 0.1 | 0.5 | 0.4 |
ResolutionTime node: How long did the technician take to resolve the issue? Resolution time has been discretized into 0-1 day, 2-3 days, and 4+ days buckets. It is, of course, influenced by the relative difficulty of the ticket, but also by more human factors like procrastination, level of expertise, and so on.
| Difficulty | P(Resolution Time = 1 day) | P(Resolution Time = 2-3 days) | P(Resolution Time = 4+ days) |
| easy | 0.85 | 0.1 | 0.05 |
| medium | 0.4 | 0.5 | 0.1 |
| hard | 0.05 | 0.2 | 0.75 |
Final outcome – CustomerSatisfaction node: a rating is given by the customer once the ticket has been closed. Ratings have also been discretized into OK (3-5 stars) and NotOK (1-2 stars) buckets. We know from collating past customer ratings and comments that same-day response, resolution times, and being kept updated are important factors that influence the final score.
| SameDay Response | Interim Updates | Resolution Time | P(Satisfaction = OK) | P(Satisfaction = Not OK) |
| True | 0 | 1 day | 0.9 | 0.1 |
| True | 0 | 2-3 days | 0.5 | 0.5 |
| True | 0 | 4+ days | 0.3 | 0.7 |
| True | 1 | 1 day | 0.9 | 0.1 |
| True | 1 | 2-3 days | 0.6 | 0.4 |
| True | 1 | 4+ days | 0.55 | 0.45 |
| True | 2 | 1 day | 0.8 | 0.2 |
| True | 2 | 2-3 days | 0.75 | 0.25 |
| True | 2 | 4+ days | 0.7 | 0.3 |
| False | 0 | 1 day | 0.8 | 0.2 |
| False | 0 | 2-3 days | 0.4 | 0.6 |
| False | 0 | 4+ days | 0.2 | 0.8 |
| False | 1 | 1 day | 0.8 | 0.2 |
| False | 1 | 2-3 days | 0.55 | 0.45 |
| False | 1 | 4+ days | 0.45 | 0.55 |
| False | 2 | 1 day | 0.75 | 0.25 |
| False | 2 | 2-3 days | 0.65 | 0.35 |
| False | 2 | 4+ days | 0.6 | 0.4 |
Implementation
Example query 1
What is the probability of CustomerSatisfaction?
One of the advantages of Bayesian networks is that we can obtain probability distributions for combinations that we did not define upfront. So at each stage where we have new information, we can obtain the latest probability of customer satisfaction given what we know up to that point. For instance, having input all the conditional probabilities into our network above, we can now create a query to establish what the overall probability of customer satisfaction is at the outset of a ticket being logged. At this point, we will have just 2 pieces of information available: Timing and Difficulty. Given just these 2 pieces of information we can obtain the initial probabilities for an OK customer satisfaction outcome:

Here we can already see that irrespective of what time of day a ticket is logged, hard tickets are very much more at risk of a poor customer satisfaction outcome, followed by medium, followed by easy. We can also see that in each instance tickets logged in the afternoon are even more at risk than their counterparts logged in the morning. This all makes intuitive sense, but it is insightful to see the extent of the differences: it drives home the need to put in extra effort with those harder tickets.
Example query 2
Given a hard ticket, quantify the impact of resolution time and interim updates?
Since the hard tickets are the most at risk, how should we best handle these tickets over time? We can visualize the impact of providing interim updates in combination with resolution times to assess this question:
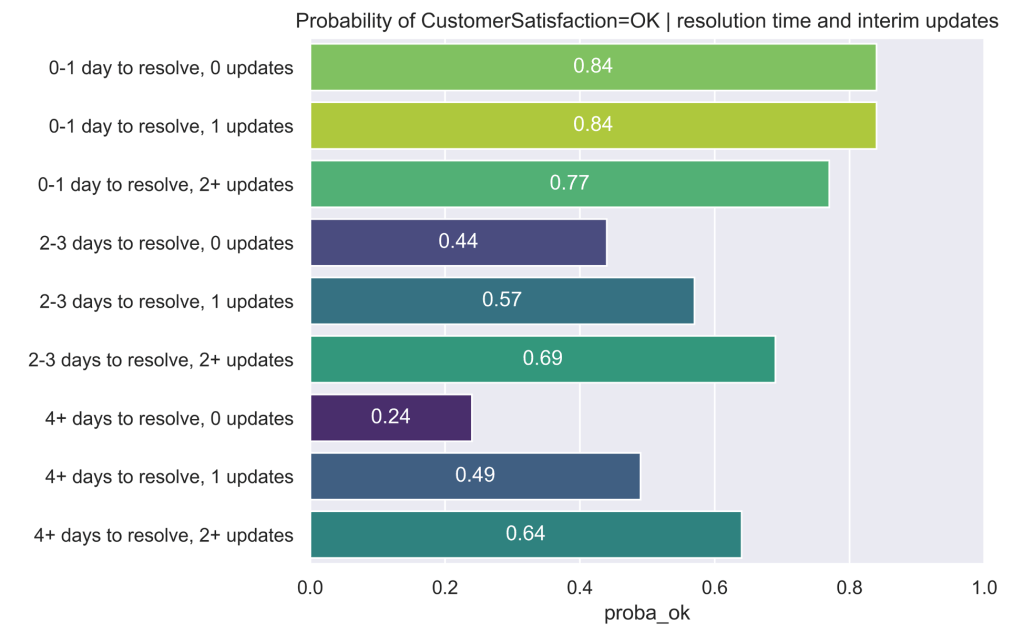
From the above, we can see that during days 0-1 we need not worry much about interim updates. If we’re working on the ticket and we’re highly likely to finish it within 1 day, then just keep working and get it done because we’re on track for a decent customer satisfaction outcome. In fact, too many updates within a short space of time appear to result in a lower customer satisfaction probability (0.77 for 2+ updates compared with 0.84 for the others)!
However, once the ticket drags on into the 2–3-day timespan updates become more important: there should be at least 1 update to ensure there is still even a chance of customer satisfaction.
And by the time we reach the 4+ days timespan at least 2 updates should have been issued to stay on track for a good outcome.
Example query 3
Given a ticket’s satisfaction outcome – what is the probability it received a same-day response?
In this instance we are backtracking within the model: given that a ticket received a particular customer satisfaction outcome, what is the probability it received a same-day response?
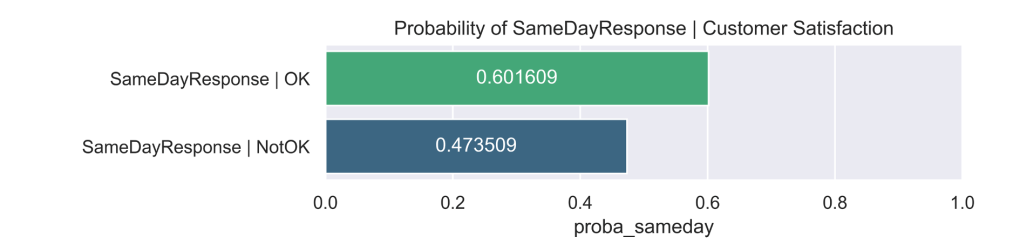
Again, the sentiment behind these numbers could probably be intuited by most rational service desk agents but quantifying the extent of the difference that a same-day response makes in this way is much more impactful – and demonstrates clearly how a quick, simple action like responding to the customer sooner rather than later can make all the difference!
To see the implementation of the Bayesian network using the pgmpy library, you can have a look at the notebook in my Github repo: