In mid-2023 AI was becoming a hot topic! ChatGPT launched on 30 November 2022 and took (at least parts of) society by storm. And for the first time in my life I would walk into my local café and hear people chatting about AI, arguing about AI, marvelling at AI…
As part of my MSc I had been tasked with doing an end-to-end data analysis project – starting with survey design, through data collection, data wrangling, results analysis, and presentation. It seemed like the timing was perfect to center this project around the topic of AI. To this end I co-opted a company that was interested in gathering information on their staff attitudes and outlooks as well as perceived effects in the workplace and set to work.
The real world is open-ended
Unlike many data science projects where one often has a well-defined objective and some data (even though it’s usually imperfect), a data analysis project may start life fairly ill-defined and this one was no exception! Together with the company CIO we teased out 4 main research questions that we wanted to answer:
- Awareness: To what extent are employees exposed to and familiar with concepts around artificial intelligence?
- Attitudes: Are attitudes positive or negative towards artificial intelligence generally?
- Current adoption: Are employees already aware of, and using, AI tools personally or professionally?
- Future outlook: What impact do employees expect artificial intelligence to have on them within the next 5 years?
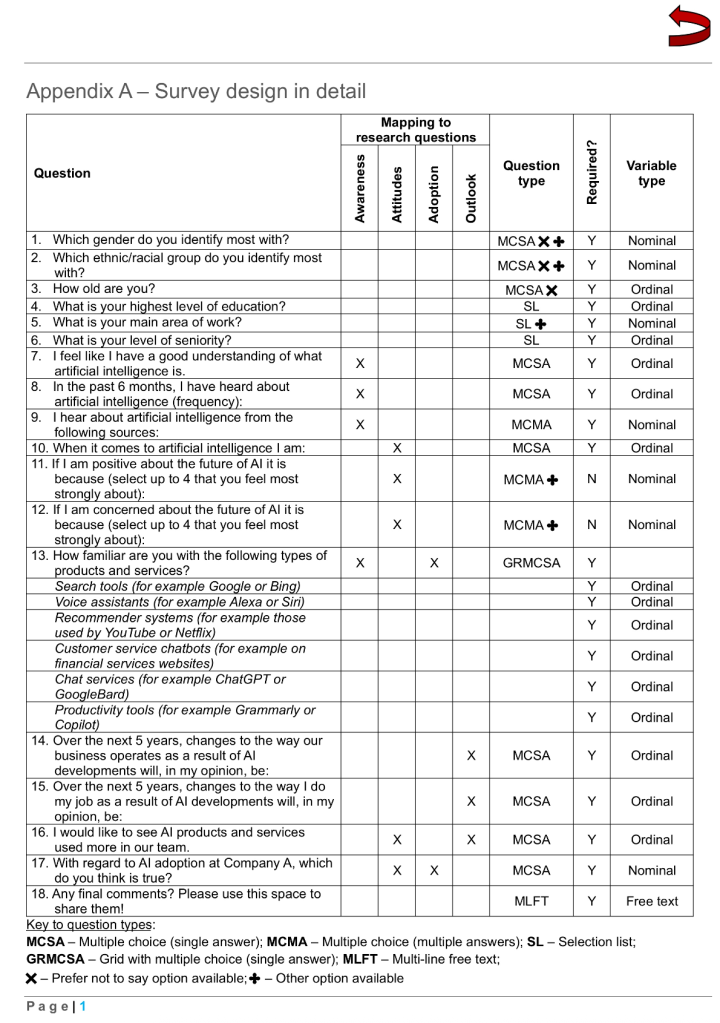
The aim was to produce a survey that would take around 5 minutes to complete. A total of 18 questions was devised (6 of which were covered non-technical aspects like gender, area of work and so on). Given that the survey was targeting a predominantly non-technical audience, it was important to word individual questions in a way that was accessible, but at the same time did not bias the respondent towards any particular answer, or leave them feeling judged if they did not know an answer. The questions flowed from general to specific and from past to future. Some survey questions served a dual purpose being relevant to more than one research question:
Using a pilot group to get feedback on the survey design was incredibly useful, highlighting where question wording needed to be tweaked, available options needed to be changed or better explanations provided.
Data collection
The company employed ~2300 people at the time. The survey was promoted to employees via the executive management of each work area and participation was voluntary. The CIO felt this method of circulation would ensure the best response, but it also means that I was unable to say exactly how many people were invited to participate. In relation to the total population, setting our sights on a confidence level of 95% with a margin of error up to 10%, I used the following formula to calculate that we ideally wanted at least 92 respondents (Remesher, 2021):

When the survey closed there were a total of 290 respondents – a response rate of 12.5% which exceeded expectations.
Data wrangling
Except where open-ended questions are posed, survey data is often very pleasant to work with as it produces structured, uniform data! Most questions in the survey required Likert-scale type answers (e.g. Strongly disagree, Disagree, Neither disagree nor agree, Agree, Strongly agree) or multiple choice selections. The only data-wrangling required was to drop columns not required for the analysis and correct some data types.
Results analysis
Results needed to be presented in ‘executive-friendly’ format: very graphical to drive home the main findings easily (‘a picture is worth 1000 words’), sufficient detail to be meaningful but not so much as to overwhelm, and then interpretation of the findings was of course key.
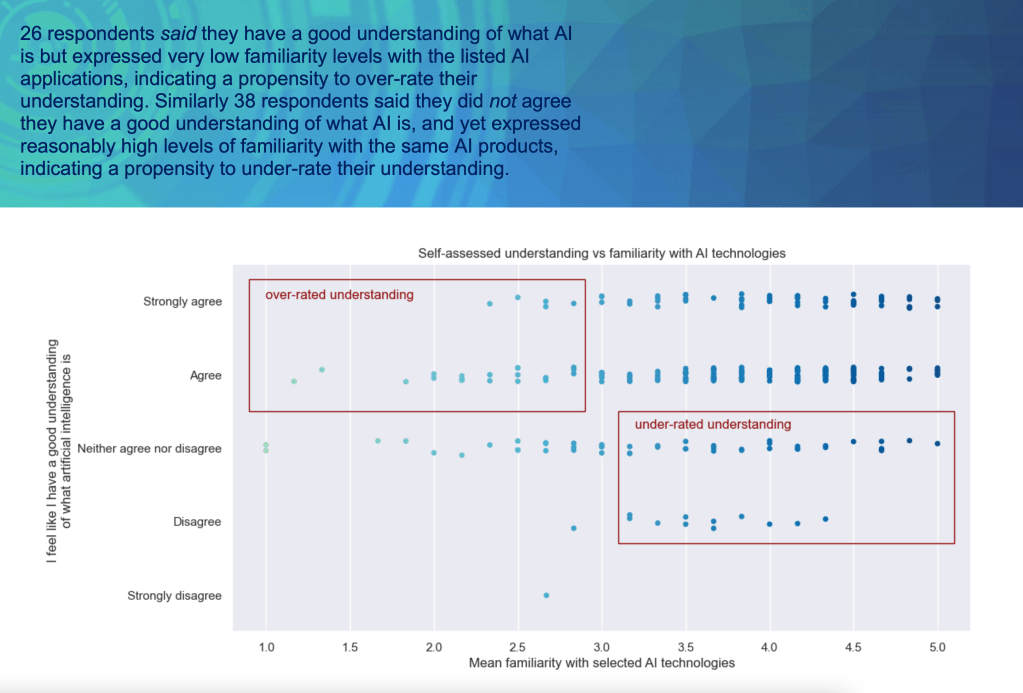
For example the following page juxtaposed the answers to 2 questions (self-rating on AI understanding vs actual familiarity with common AI technologies) to highlight that a fair portion of respondents either under- or over-rate their understanding of the topic (also known as the Dunning-Kruger effect):
The full results analysis (as well as all the under-the-hood stuff to get there) is available via my Github repo, if you’d like to read more 🙂.
