Populations
We can think of the population as the complete set of “things”, whatever the “things” are that are under consideration – for example if we’re interested in studying the height of men in South Africa, then the population would be all adult men in South Africa.
A population can be described by parameters. Here’s what we need to know in terms of notation and formulas:


Mean

(pronounced “mew”)
We all know how to calculate the mean! This is how we write the ‘formal’ formula:

Variance
The variance measures the spread of your dataset. The larger the variance the more spread out your data is in relation to the mean.

(pronounced “sigma squared”)
This is the formula for calculating the variance:

As we can see, the final number for variance is squared, so it is not expressed in the same units as the original data. This makes it a little un-intuitive to work with which is why the standard deviation is often used in preference.
Standard deviation
The standard deviation also tells us the spread of our data in relation to the mean but in the original units of the dataset.

(pronounced “sigma”)
This is the formula for calculating the standard deviation:

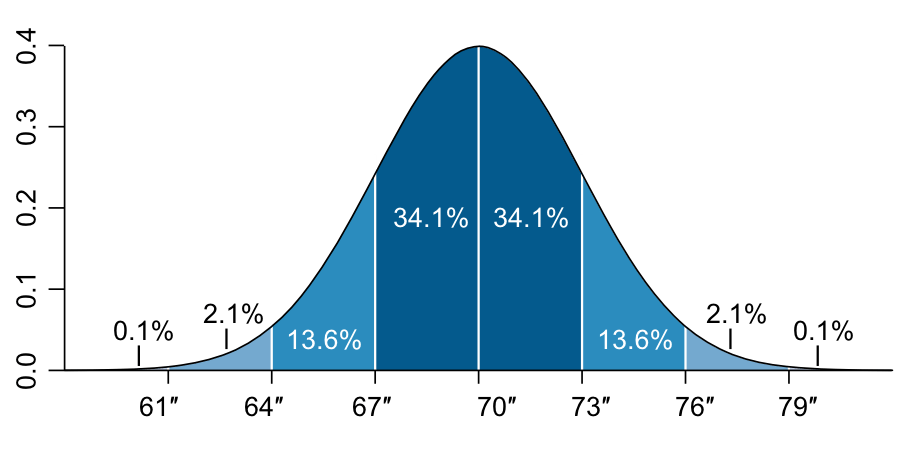
Because we end up with a number expressed in the same units as our dataset, this number is easy to understand. For example (if our data is normally distributed) a mean of 5.5 with a standard deviation of 1 means practically that:
- About 68% of the data points will lie within one standard deviation from the mean (i.e., between 4.5 and 6.5)
- About 95% of the data points will lie within two standard deviations from the mean (i.e., between 3.5 and 7.5)
- About 99.7% of the data points lie fall within three standard deviations from the mean (i.e., between 2.5 and 8.5)
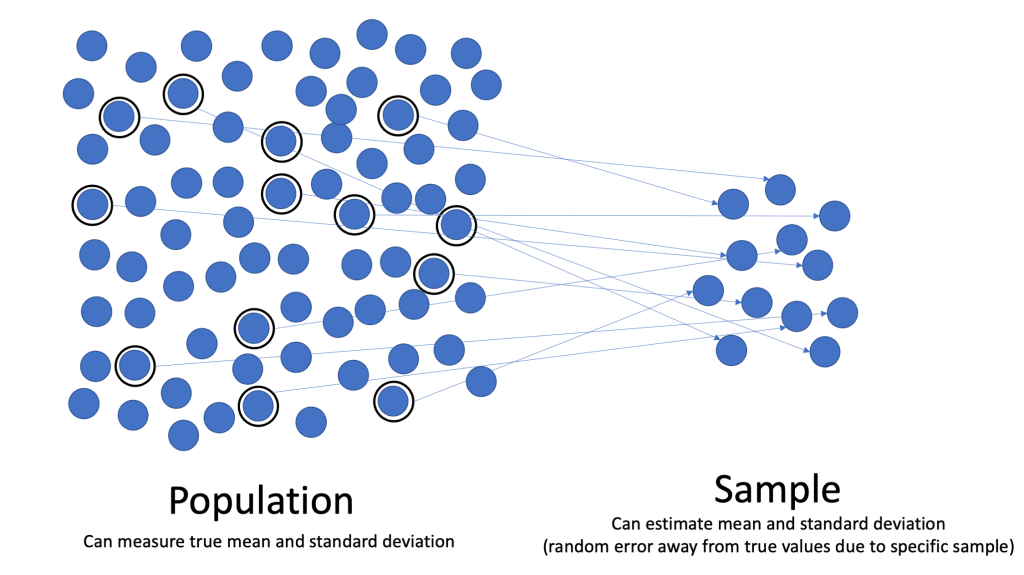
Samples
For most use cases we cannot work with populations. Surveying every single man in South Africa to determine his height is not feasible! Usually we work with samples instead. The trick with samples is that they need to be as representative as possible and free from potential bias. Sampling is therefore quite an art! For example for our use case we’d need to take into account factors like:
- At what age do we say a male human is a man?
- What is the distribution of ages in the population?
- What is the geographical distribution of men across the country?
- What about rural vs urban men?
- etc.
If done judiciously we end up with a subset of the data that we can work with to extrapolate information about the population as a whole. The sampling error or standard error expresses the variation that occurs between different samples from the same population. The formula is:

The standard error can typically be reduced by increasing the sample size. The more representative our sample is of the true population, the smaller the standard error becomes.
When working with a sample instead of with a population the following notation elements and formulas are adjusted:

Mean
The symbol for the mean of a sample is different:

(pronounced “x-bar”)
The formula is therefore expressed as follows:

Variance
The symbol for the variance of a sample is also different:

This is the formula for calculating the sample variance:

Wait! Why are we dividing by n-1? This post on Stackexchange explains it very nicely: we are essentially being more conservative about sour estimate of the variance – the number we get will be a little bit bigger than if we had divided by n, so we are estimating our variance to be a little bit bigger – given that we can’t know the actual variance of the population.
Standard deviation
The symbol for the standard deviation of a sample is also different:

This is therefore the formula for calculating the sample standard deviation:

