 A simple example of hypothesis testing is where we know what “normal” is, and we want to evaluate whether some sample conforms to our understanding of “normal”, or is so unusual that it’s indicative of an actual shift in behaviour or pattern.
Make your hypothesis statement
If I…(do this to an independent variable)….then (this will happen to the dependent variable) – thanks statisticshowto.com…
- If I look at fish from this ocean, then the average size is likely to be smaller
- If I offer daily specials, customers are likely to buy more often
- If I alter the dosage of a drug, it will have a positive or negative effect on recovery
Notice how the hypothesis statement can be about things getting bigger or smaller or just changing in some way!
Formulate the null and alternate hypotheses
The null hypothesis represents our understanding of “normal”. The alternate hypothesis would be “not normal” – which would allow us to say “yes, this sample is genuinely remarkable in the way that we hoped or feared it would be”. In other words: for the sample we have, we can reject the null hypothesis. For example, a certain species of fish is normally 30cm or greater, but we suspect that fish in the Atlantic Ocean will be smaller:
- H0 : μ ≥ 30
- H1 : μ < 30
What do we have to work with?
In this kind of hypothesis testing you have a LOT of information available:
- You know the mean and the standard deviation of the population (aka “normal”)
- You’ve also collected sample results of your own, so you have a sample size and a sample mean (and you’re going to evaluate how “normal” your sample results are!)
- Desired confidence level (typically 5%, often expressed as α)
What are we actually looking for?
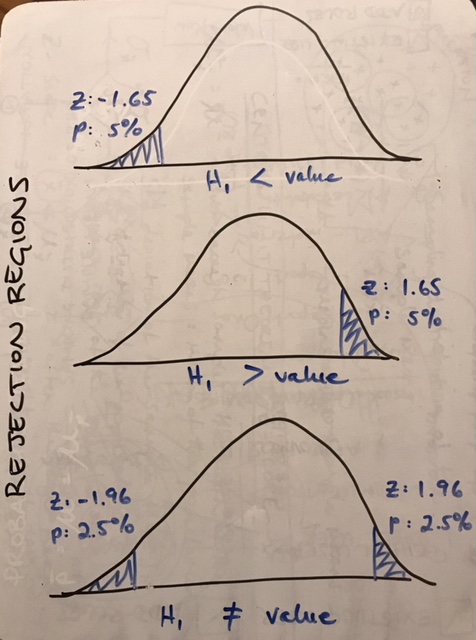
Visually, to reject the null hypothesis (H0) our sample would have to fall into what is known as the rejection region. The rejection region varies according to the parameters of your hypothesis:
So how do we do it?
Using our old friends, the central limit theorem and the z-score! Here’s an example:
We know that the average size of a certain species of fish is 30cm with a standard deviation of 8cm. We have measured a random sample of 50 of this species from the Atlantic Ocean and found the average size is 25cm. Is it likely that the fish from the Atlantic Ocean are generally smaller?
μ = 30
σ = 8
x̄ = 25
n = 50
H0 : μ ≥ 30
H1 : μ < 30
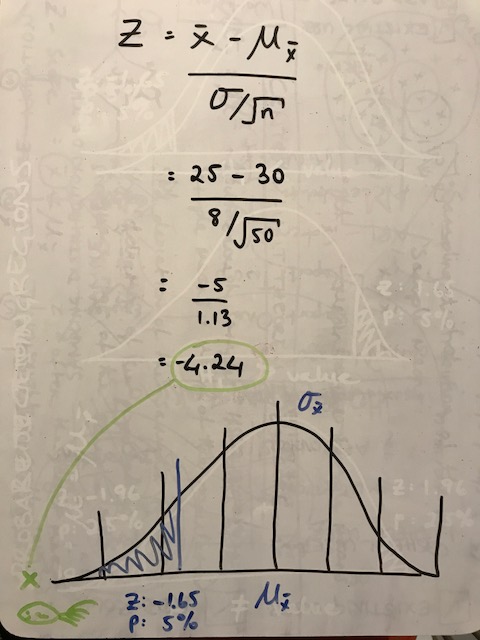
The z-score of -4.24 is so far left of our minimum rejection region of -1.65 that we can confidently reject the null hypothesis, and therefore say that it IS likely this species of fish in the Atlantic Ocean is generally smaller!
